In the previous posts of this series, I explored the potential for ecological restoration and reforestation in the Washington Cascades, focusing initially on what I thought was the I‑90 corridor near Snoqualmie Pass. As I later discovered, that study area actually centered around US Highway 2—a simple mistake due to highway labeling in the basemap I used to select data. Thankfully, this realization didn’t undermine the validity of the modeling itself—it simply meant I needed to correct the highway label and be more mindful when selecting future areas.
And that’s exactly what I did in this next phase.
A New Study Area East of the Cascades
This time, I deliberately selected a region east of the Cascades, where the landscape transitions into the Columbia Plateau. While the biodiversity and land-use context here is different, this landscape offers a compelling contrast: flatter terrain, fewer development barriers, and multiple smaller highways intersecting ecologically important areas.
What Changed in the Model?
The method remained consistent:
- Reclassified Land Cover: Same values as before (Grassland = 7, Shrub/Scrub = 5, others = 0)
- Reclassified Slope: Same slope score breaks (0–10% = 9, >60% = 0)
- Raster Calculator: Weighted average of land cover (60%) and slope (40%)
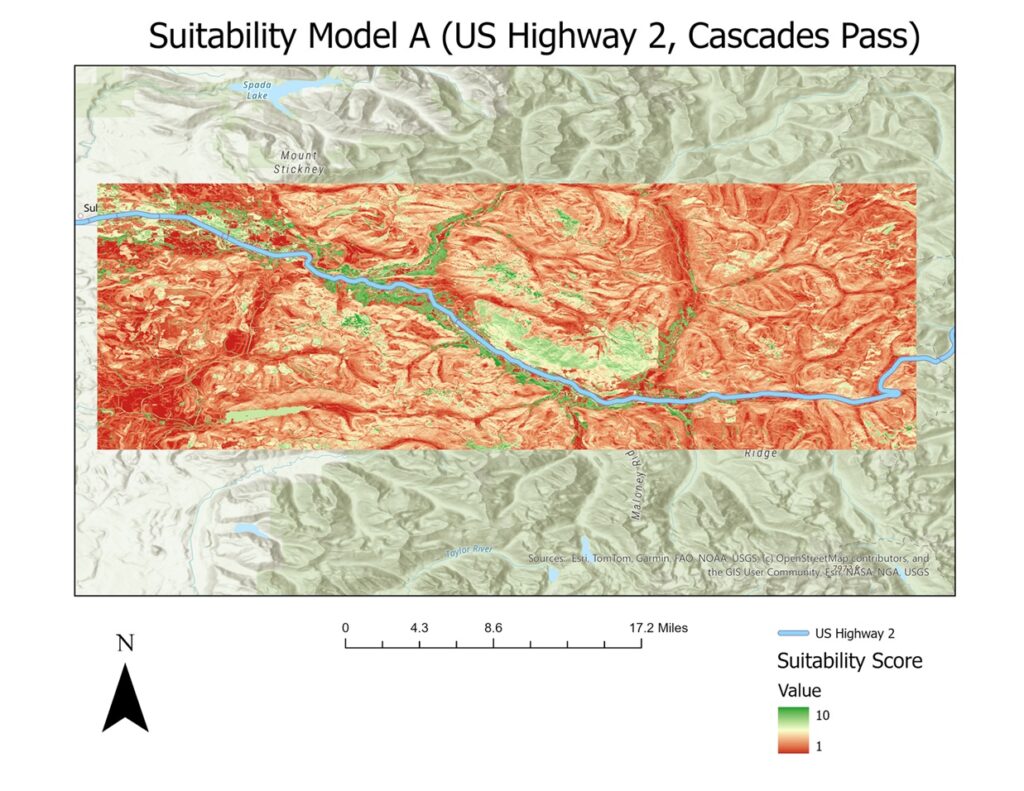
But the difference in topography made a big impact. In the Cascades, the mountainous terrain meant most of the study area scored quite low (in red), with only scattered pockets of green. In contrast, this new study area is much more forgiving—the slope reclassification produced much higher scores overall, particularly in flatter valley regions.
Biodiversity: What Data I Had
Unlike species-level biodiversity data, which can be difficult to obtain, I relied on a polygons layer of ecoregionally important zones for masking. While this doesn’t tell us exactly which species are present, it provides a meaningful filter to identify zones that conservation planners have already flagged as significant.
When I clipped the model’s output to these areas, the results were promising: many of the green, high-suitability zones overlapped well with the conservation polygons—and several of them were adjacent to existing highways that see less traffic and development pressure than the congested mountain passes.
Visual Comparison
I created two suitability maps using the same modeling approach:
- One centered on US Highway 2 through the Cascades (mistakenly labeled I‑90 in the original posy)
- One east of the mountains, near the Yakima Indian Reservation, incorporating biodiversity masks
As shown, the flatter landscape east of the divide provides significantly more green—more places where slope and land cover combine to offer realistic opportunities for ecological restoration, wildlife crossings, or conservation infrastructure.
So Where Do Wildlife Crossings Make the Most Sense?
The Cascades have symbolic and practical significance, and large-scale projects like the I‑90 Wildlife Bridges near Snoqualmie are important milestones. But based on the data I’ve been able to model so far, the best opportunities for future crossings may not lie in the rugged mountain terrain, but in the quieter, more connective landscapes to the east—especially if they are already flagged as biologically important.