Back when I first created Breathing Room, I was focused on modeling where infrastructure could align with subsurface geology—particularly in terms of saline reservoirs and depleted oil & gas fields. I used Python to identify ideal areas of the country for CCS as well as specific power plants which would be ideal candidates to deploy the technology, but looking back, I realized something was missing: narrative clarity.
Inspired by Flora Vale’s presentation at the 2025 Esri User Conference, which emphasized the power of supplemental charts to enhance storytelling, I decided to revisit this project with that in mind—and create two new charts.
Power Plants by Energy Source (Total Megawatts)
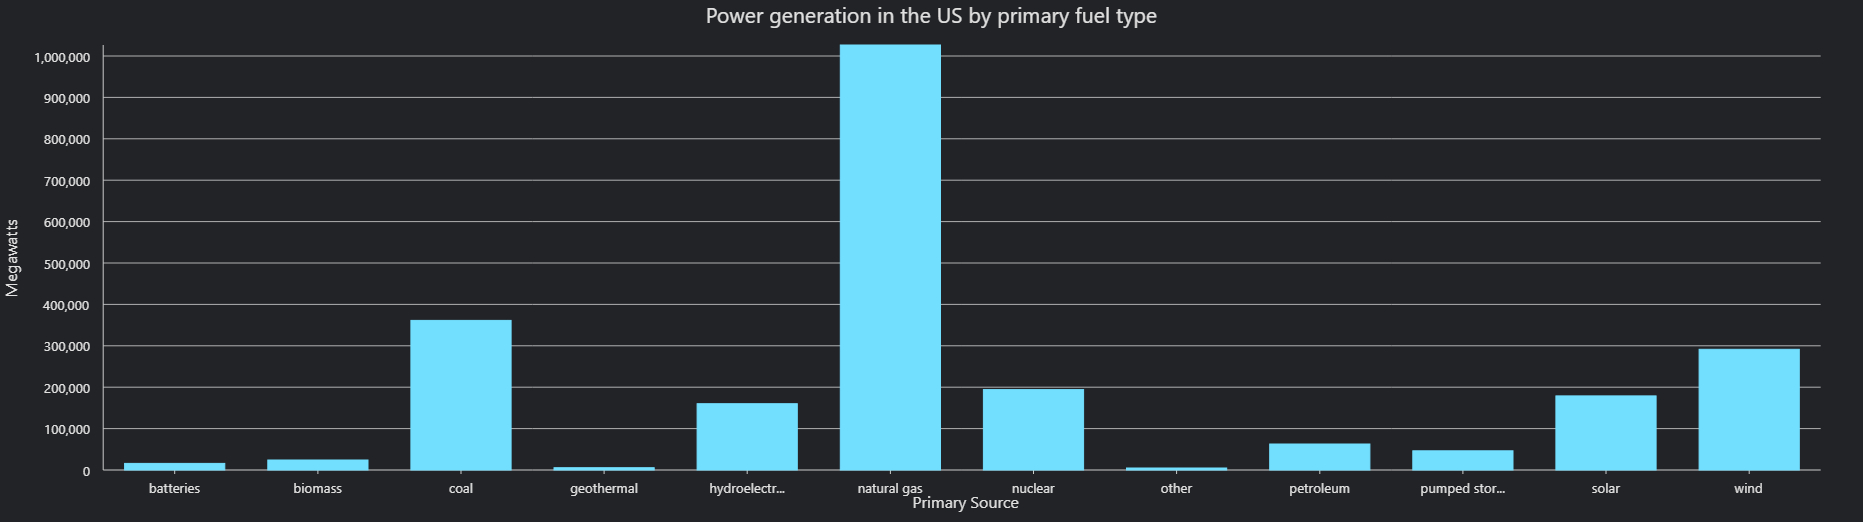
My first chart breaks down total energy output capacity (in MW) by each power source in the U.S., offering a clearer view of the emitters most in need of CCS solutions. Not surprisingly:
- Natural Gas dominates the landscape, with over 1 million MW total.
- Coal still accounts for a significant share (~350,000 MW), despite widespread decommissioning.
But more encouragingly, Wind (~300,000 MW) and Solar (~200,000 MW) are rapidly closing the gap—signaling a growing shift toward renewables, and suggesting that renewables are no longer the expensive and inefficient fringe solution they’re often made out to be. They’re becoming real players in the national energy landscape, especially when you consider:
- Many older fossil fuel plants are reaching the end of their lifespans regardless.
- Wind and solar are often easier to pair with CCS where viable, or may reduce the need for CCS by displacing emissions in the first place.
- If you compare the speed of growth over the last decade, renewables have been growing exponentially while fossil fuel expansion has slowed.
On-site CCS vs. Pipeline: A Pie Chart Breakdown
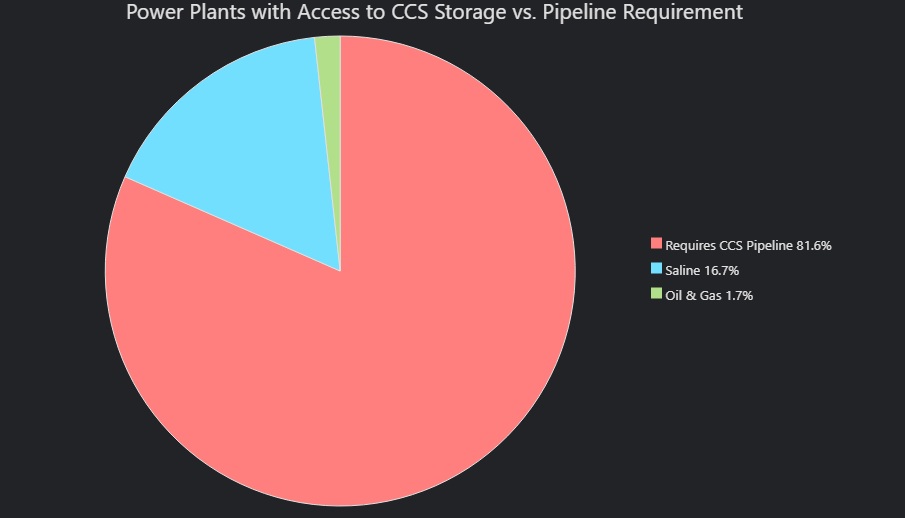
My second chart reclassifies the intersected point data to answer a key infrastructure question:
How many power plants already sit atop viable CCS storage formations?
- 18.4% are located on either saline or oil/gas storage sites.
- 81.6% would require new pipeline infrastructure to transport CO₂ to storage.
While Flora mentioned that she’s not a huge fan of pie charts, I felt it was the most appropriate choice here to convey percentage-based spatial alignment in a direct and digestible format.
And either way, this chart highlights an important logistical challenge: the vast majority of emitters would still require extensive pipeline infrastructure to transport captured CO₂ to viable storage locations. In other words, while CCS is technologically feasible, its geographic mismatch with existing emitters adds a major hurdle to large-scale deployment—especially for sectors already facing tight margins or public scrutiny.
Final Thoughts
This update isn’t just about new visuals—it’s a reflection of how I’m evolving both as a GIS analyst and as a storyteller. Flora’s talk reminded me that how we communicate spatial insights can matter just as much as the maps themselves.
In addition, in order to create the second pie chart, I also got some great practice in how to use the Merge tool to combine my existing Power Plants and Oil/Gas/Saline reservoir layers, and then Python to populate the Storage Type field with a category (Oil/Gas, Saline, or Pipeline Required) to be used for the pie chart itself.
More post-Esri UC updates to other Terra Curiosity projects may follow—but for now, these two additions felt like the perfect way to bring my CCS Suitability analysis into a broader focus.