When I first started this project, I intended to dive right into a habitat suitability model for wildlife corridors along Washington State’s I-90. But as often happens in real life, things took a different path.
Between Esri UC, increasing my volume of job applications for the fall hiring season, and my visits to Oregon for sightseeing and to interview for a position with City of Eugene Public Works, I found myself pulled away from research projects for a while. Still, this project never stopped lingering in the back of my mind—because it connects so strongly to what I care about most: restoring broken connections between ecosystems, and between ourselves and the natural world.
So now that I’ve had time to regroup, I’m picking up where I left off.
A Quick Recap
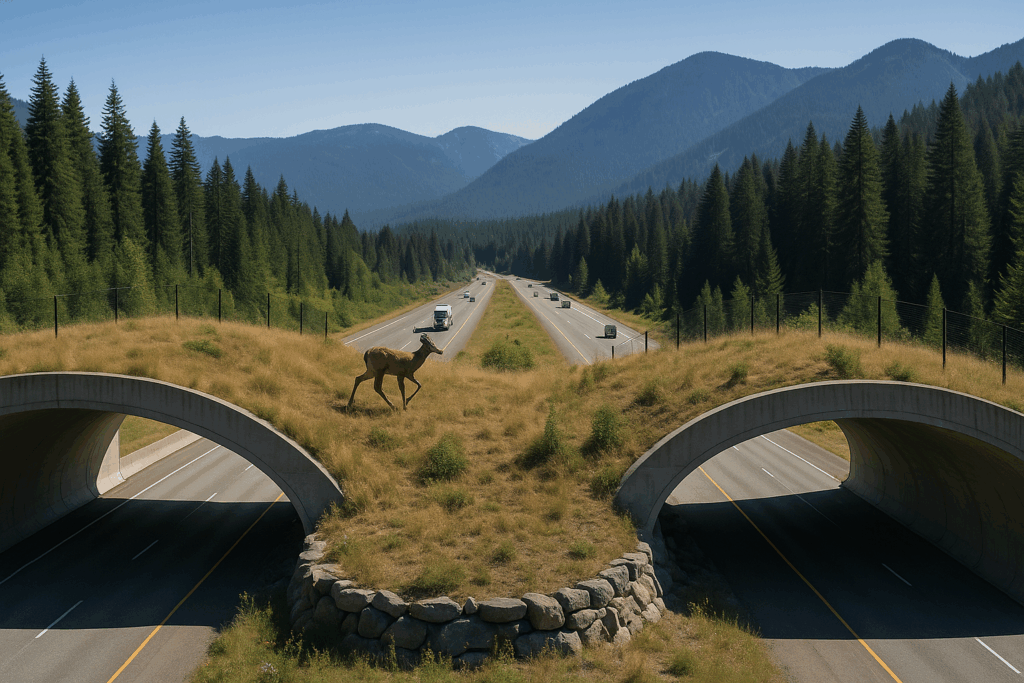
In Part 1, I laid out my intention: to identify where a wildlife corridor across Snoqualmie Pass might be most ecologically viable. I planned to build a suitability model using GIS layers like land cover, slope, roads, and protected areas—emphasizing symbolic reconnection as much as spatial logic.
That intention hasn’t changed.
What has changed is my timeline and approach. I’m now giving myself room to finish this at my own pace, one building block at a time.
What I’ve Assembled So Far
While I was away, I was still quietly gathering the pieces I needed—thanks in part to Stephen’s help. As of right now, here’s what I’ve got loaded into ArcGIS Pro:
- Land Cover (NLCD 2019) – downloaded from MRLC, ready for reclassification
- Roads (TIGER/Line) – including major interstates and smaller barriers
- Elevation (DEM tiles) – stitched and processed into a slope raster
- Protected Areas – interpreted manually from PDF maps since PAD-US shapefiles were inaccessible
- Species/Biodiversity Layer – acquired from Stephen, though it only covers areas east of the Cascades
So far, my work has focused on clipping, cleaning, and prepping these layers for the next step: building the suitability model itself.
What’s Next: Reclassifying and Scoring the Landscape
In the coming week(s), I’ll begin assigning suitability scores to each layer. For example:
- Forested land = more suitable than developed areas
- Flat terrain = easier for wildlife to cross than steep slopes
- Zones far from roads = better connectivity
- Areas near existing protected zones = stronger anchors
I’ll likely use a weighted overlay approach to combine these into a single suitability surface—then identify the strongest candidate zones for corridor restoration or enhancement.
What I’ve Learned (Even Before Modeling)
Even without running the model yet, this project has already taught me something important: that picking up where you left off is just as valid as starting something new.
GIS work is rarely perfect, and it’s often nonlinear. You improvise when data breaks. You refocus when life interrupts. And even if you’re moving slowly, you keep walking.
And sometimes, that’s exactly what makes the work more meaningful.
Coming in Part 3:
- Reclassification logic and scoring system
- Suitability maps in progress
- Reflections on what “corridor” really means, both ecologically and symbolically