When I began this project, my central question was deceptively simple: Where should we build carbon capture systems in the U.S.?
But as I quickly learned, answering that question requires navigating a complex tangle of geology, infrastructure, policy, technology readiness — and above all, geography. This blog series represents my journey through that complexity, using ArcGIS and spatial data to explore two distinct carbon capture approaches: Direct Air Capture (DAC) and Point Source Capture (PSC).
The Original Hypothesis
I started with a hypothesis inspired by real-world urgency:
“Certain regions of the U.S. — due to their natural resources, industrial infrastructure, and geologic features — will be more suitable for carbon capture technologies than others. GIS can help identify these regions.”
My goal was not necessarily to pick a single “best” location, but rather to explore how spatial factors influence feasibility — and whether different carbon capture strategies might fit different landscapes.
My Research Journey: Mapping CCS Potential
I began by identifying the two leading CCS approaches:
- Direct Air Capture, which filters CO₂ from ambient air using energy-intensive machines
- Point Source Capture, which captures CO₂ directly from smokestacks
Each has different siting needs. DAC requires clean, abundant energy and plenty of land. PSC, on the other hand, requires large emitters located near suitable geologic storage or transport networks.
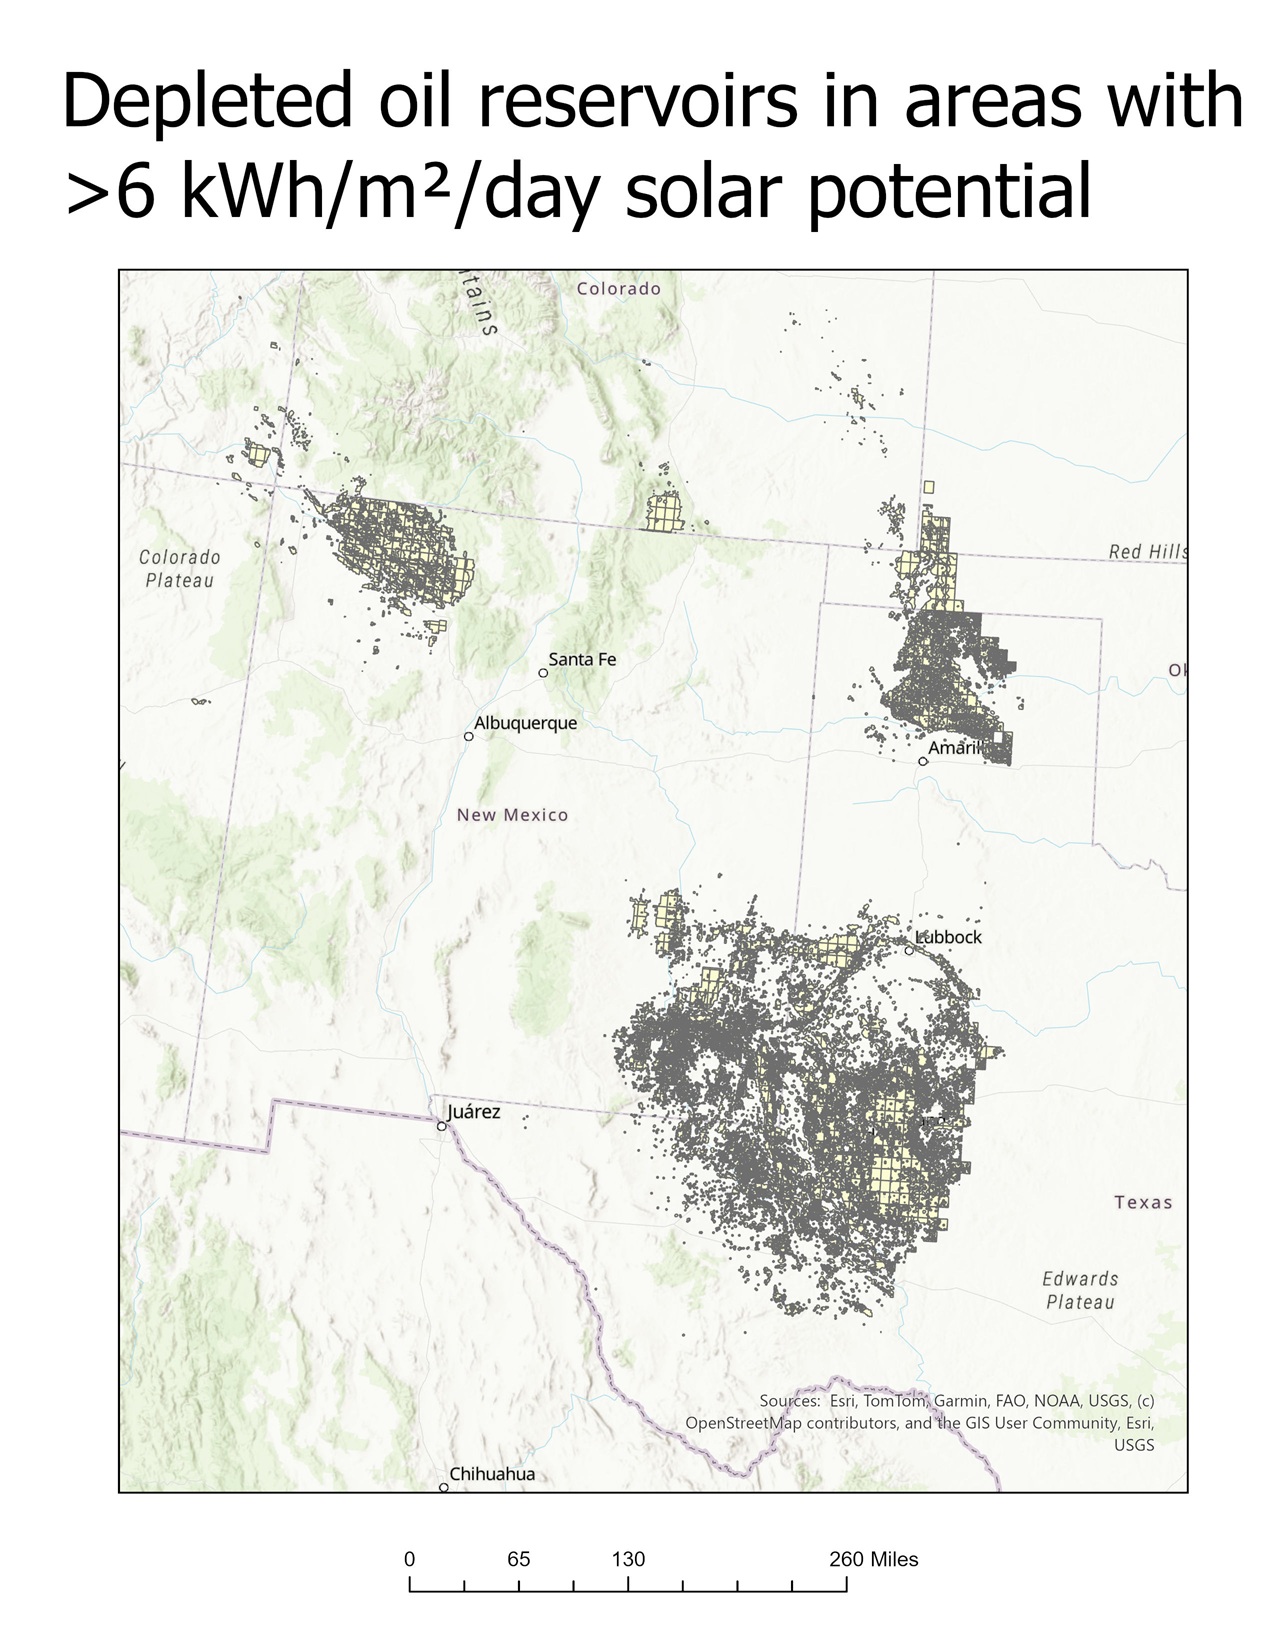
To start, I modeled the spatial suitability of DAC — focusing on where renewable energy could power these machines and where CO₂ could be stored underground. The most promising DAC regions were:
- The Oklahoma Panhandle and West Texas, with strong solar exposure and proximity to depleted oil fields
- Idaho/Montana, where certain pockets combined decent wind speed with saline geology
This post taught me the importance of resolution, projection, and scale — and also made me realize that vector-based overlays were more appropriate than raster modeling given the data I had.
One key insight, however, came from feedback I received later: wind speed at 100 meters (where turbines actually operate) is significantly higher than surface-level wind. That changes the picture for DAC feasibility — especially in places like West Texas, where both wind and solar could potentially power modular DAC units at scale.
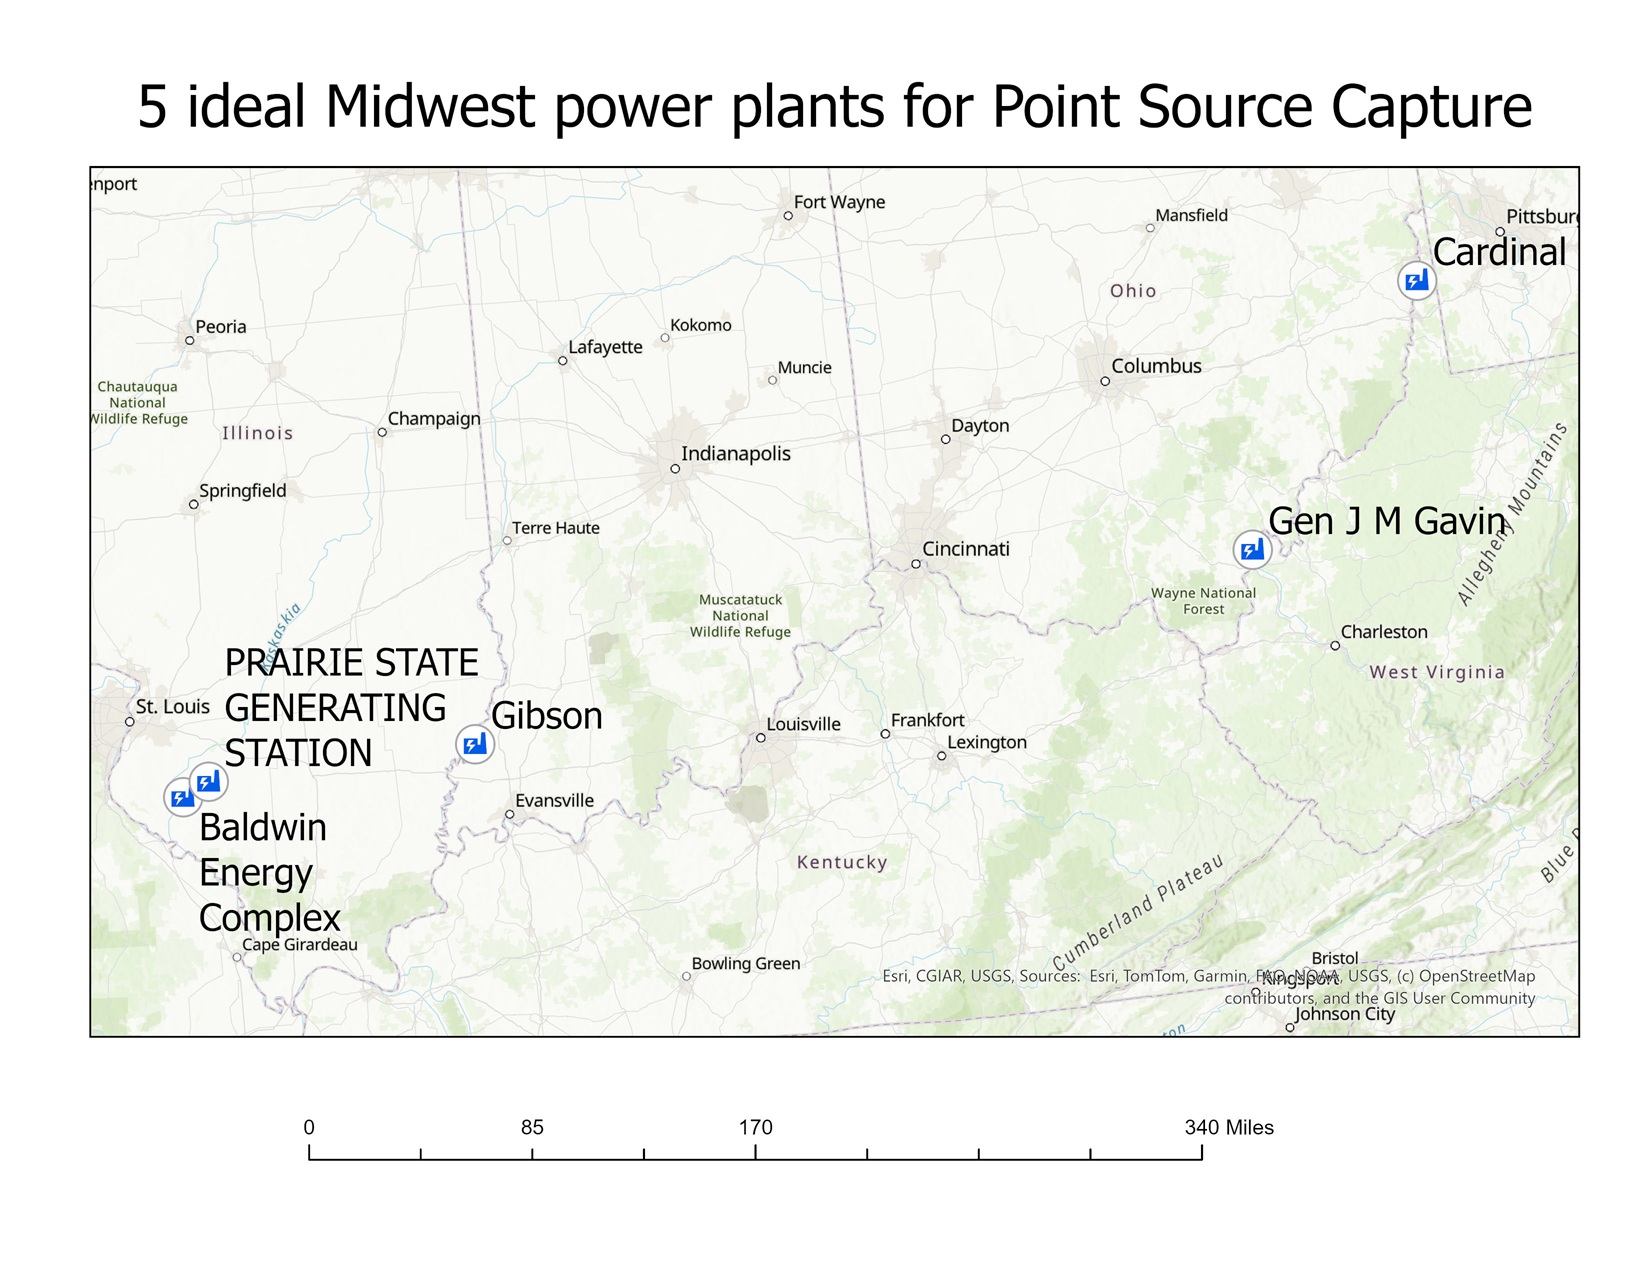
Next, I pivoted to Point Source Capture — and used EPA FLIGHT data to locate the most carbon-intensive power plants in the U.S. I filtered for facilities emitting over 1 million tons of CO₂ per year, then intersected those points with geologic storage options.
Surprisingly, there were more viable matches than I expected — especially in:
- The Ohio River Valley (over oil fields)
- The Texas Gulf Coast, Florida, and Midwest (over saline reservoirs)
PSC, it turns out, is already geographically feasible in many high-emission regions — especially for sectors like power, cement, steel, and chemical manufacturing.
After having investigated both types of CCS technology, I stepped back and compared the two directly. Ultimately, I concluded that we need a blended CCS strategy:
- PSC is perfect for high-emission industries already sitting atop CO₂ storage
- DAC is essential for legacy emissions, distributed sources, and hard-to-abate sectors
Rather than choose between them, my previous blog post shows different locations in which each can be deployed — all as part of the same blended plan towards a net-zero future.
Conclusion: GIS as a Tool for Climate Intelligence
This project reaffirmed something I’ve believed for a long time: Maps don’t just show us where things are — they help us decide what to do.
By visualizing emissions, renewables, and geology on the same canvas, GIS helped me reveal meaningful patterns that might otherwise stay buried in spreadsheets. It helped me move from general ideas to specific proposals — like:
- Prioritizing PSC at Midwestern power plants with dual-storage access
- Exploring DAC in West Texas using 100m wind speeds
- Avoiding areas where resource gaps make CCS economically unrealistic
There’s still more to do — more data to find, more layers to integrate, and more real-world testing needed. But as a proof-of-concept, this blog series has shown that spatial reasoning is indispensable for climate solutions.
Thanks for following along.
And if you’re a policymaker, planner, or curious citizen — I hope these maps give you something to think about.