Lessons from Esri UC 2025 In one of the more insightful sessions from this year’s Esri User Conference, presenter Flora […]
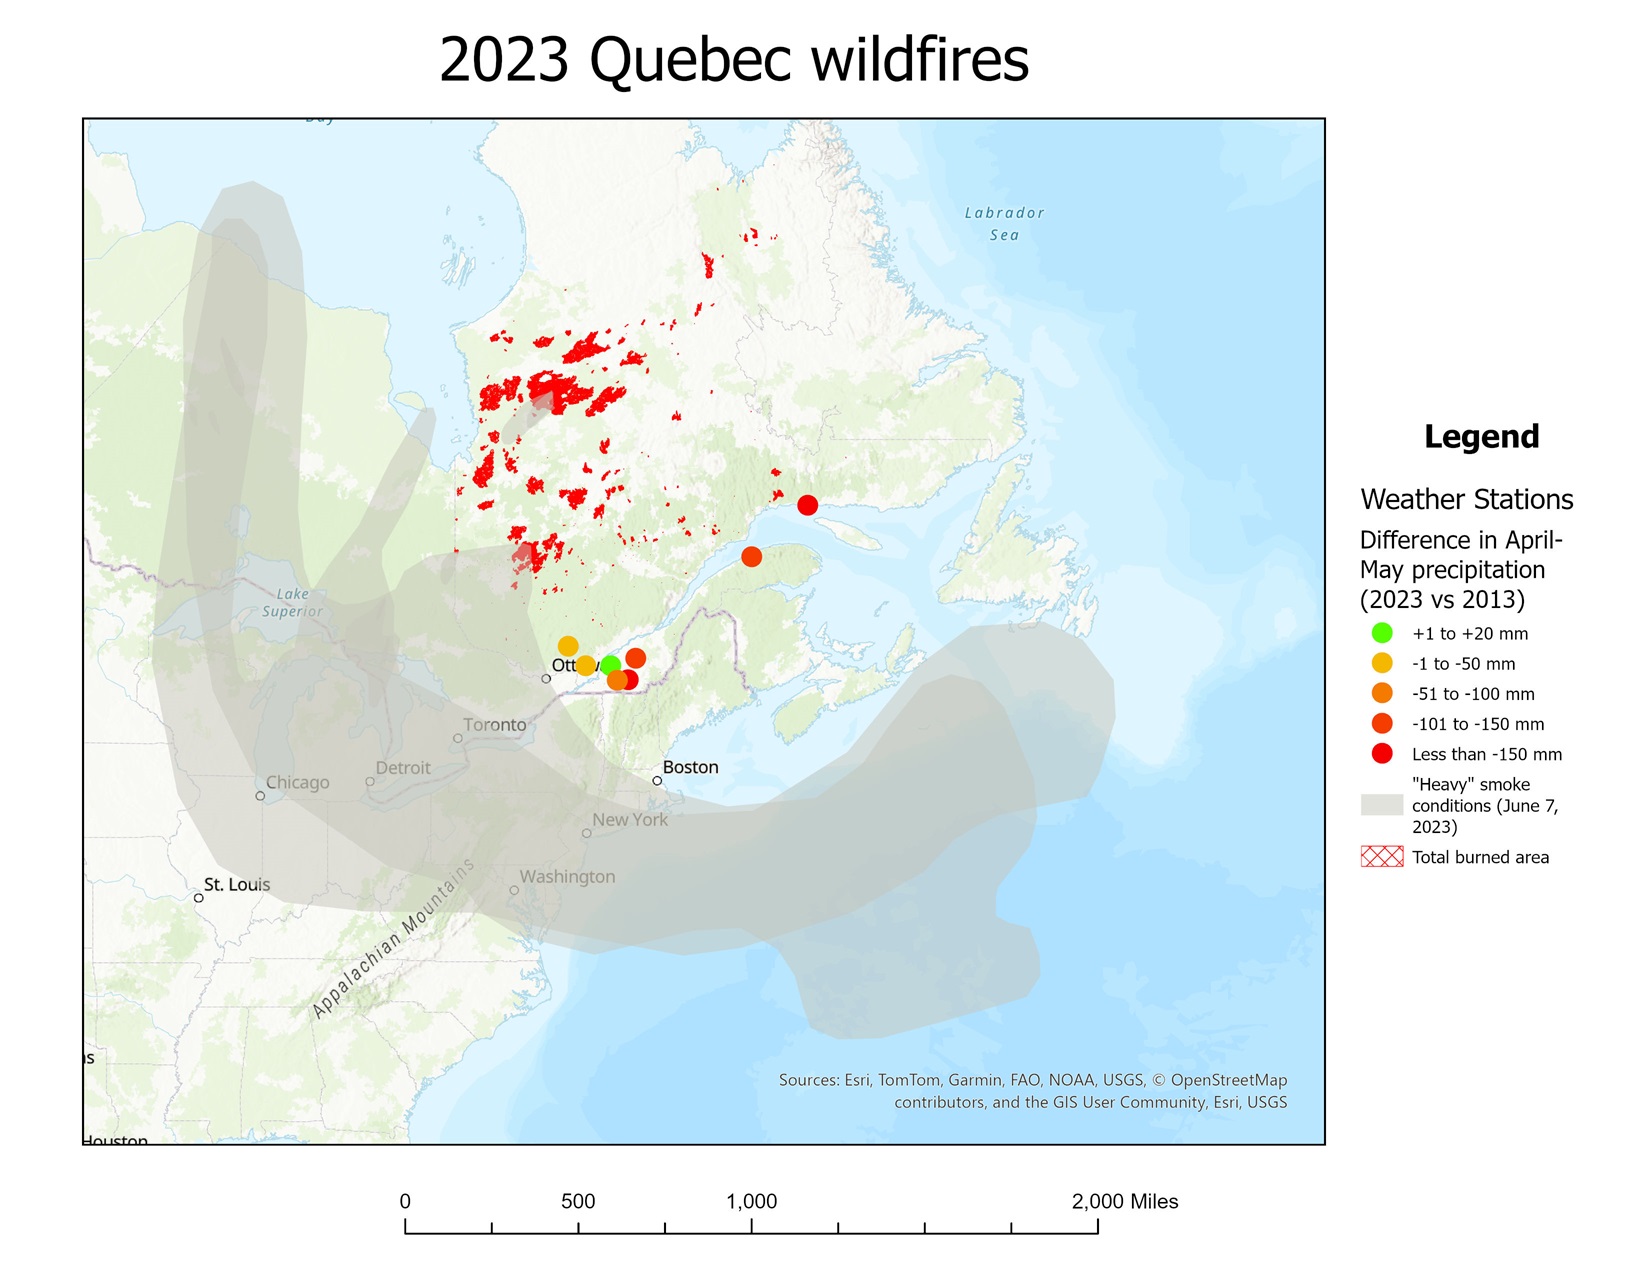
Revisiting my Quebec Wildfires project with Python: The Numbers Surprised Me
As I continue learning how to use Python with ArcGIS, I decided to revisit my previous Wildfires Project, with one […]
Mapping the Flames (Final Report): The Role of Climate Change in the 2023 Quebec and Ontario Wildfire Season
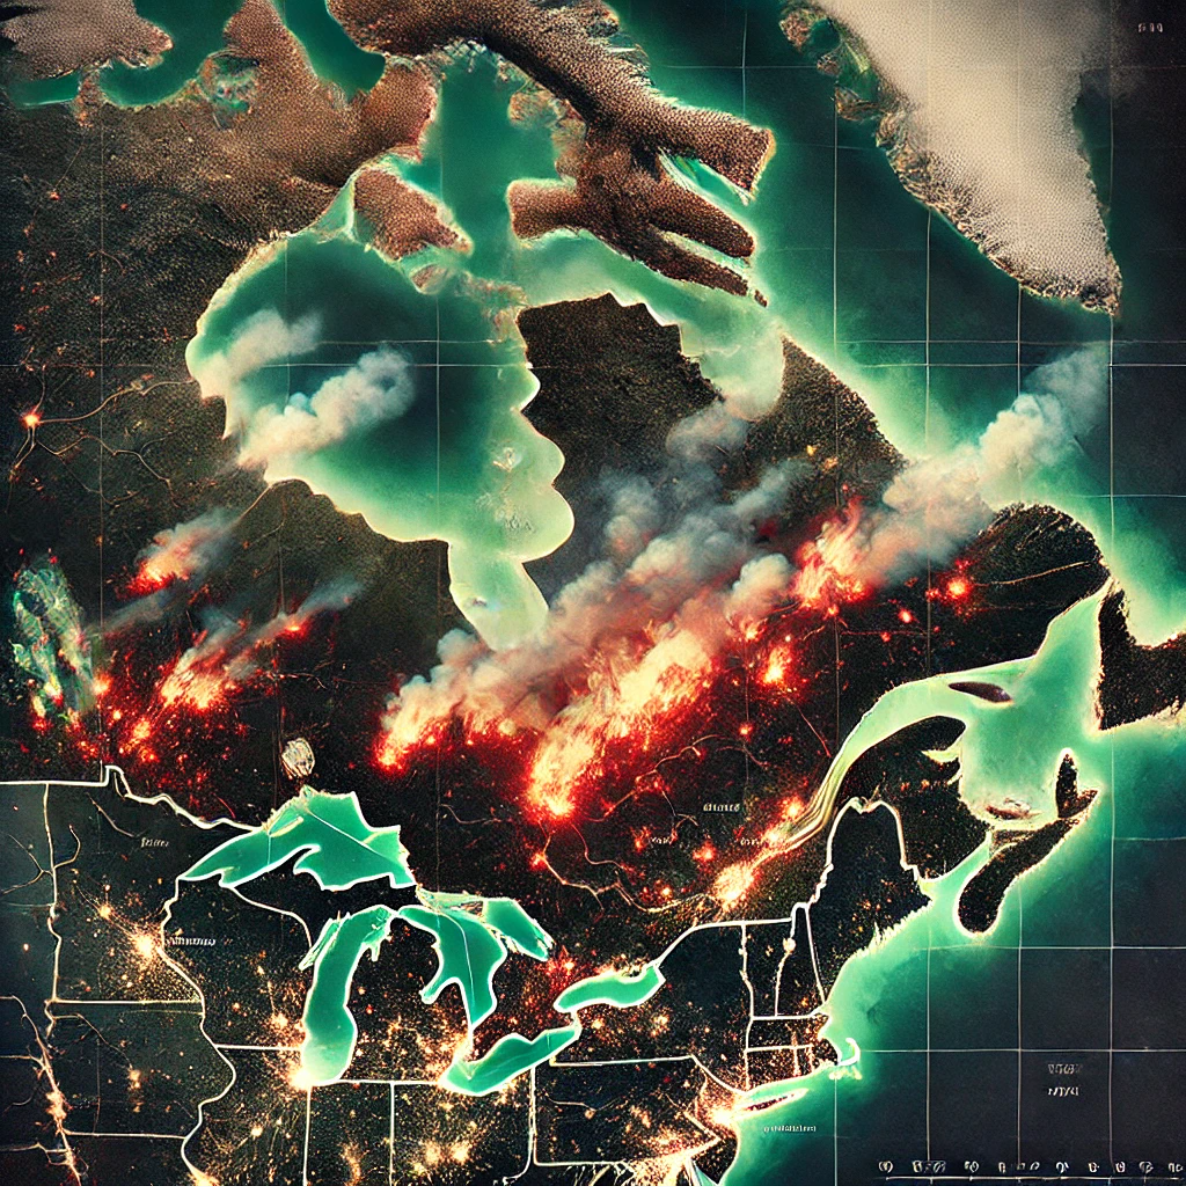
Introduction The 2023 wildfire season in Quebec and Ontario was one of the most severe in recent history, marked by […]